 Facebook
 X
X
 Pinterest
 Copy Link


The following analysis of select counties of the Western Washington real estate market is provided by Windermere Real Estate Chief Economist Matthew Gardner. We hope that this information may assist you with making better-informed real estate decisions. For further information about the housing market in your area, please don’t hesitate to contact your Windermere Real Estate agent.
Regional Economic Overview
As discussed in the first quarter Gardner Report, job growth continues to slow. Even though Western Washington added 54,391 new jobs over the past 12 months, which represented a decent growth rate of 2.3%, the slowdown in the creation of new jobs is palpable. The regional unemployment rate in May was 3.7%, which is marginally above the 3.4% of a year ago. As we enter the summer months, I have started to ponder the economic outlook for the balance of this year as well as looking ahead to 2024. Although many are still suggesting a looming recession, I remain unconvinced. However, if enough people expect to see an economic contraction, it can become a self-fulfilling prophecy, which has happened in the past!
Western Washington Home Sales
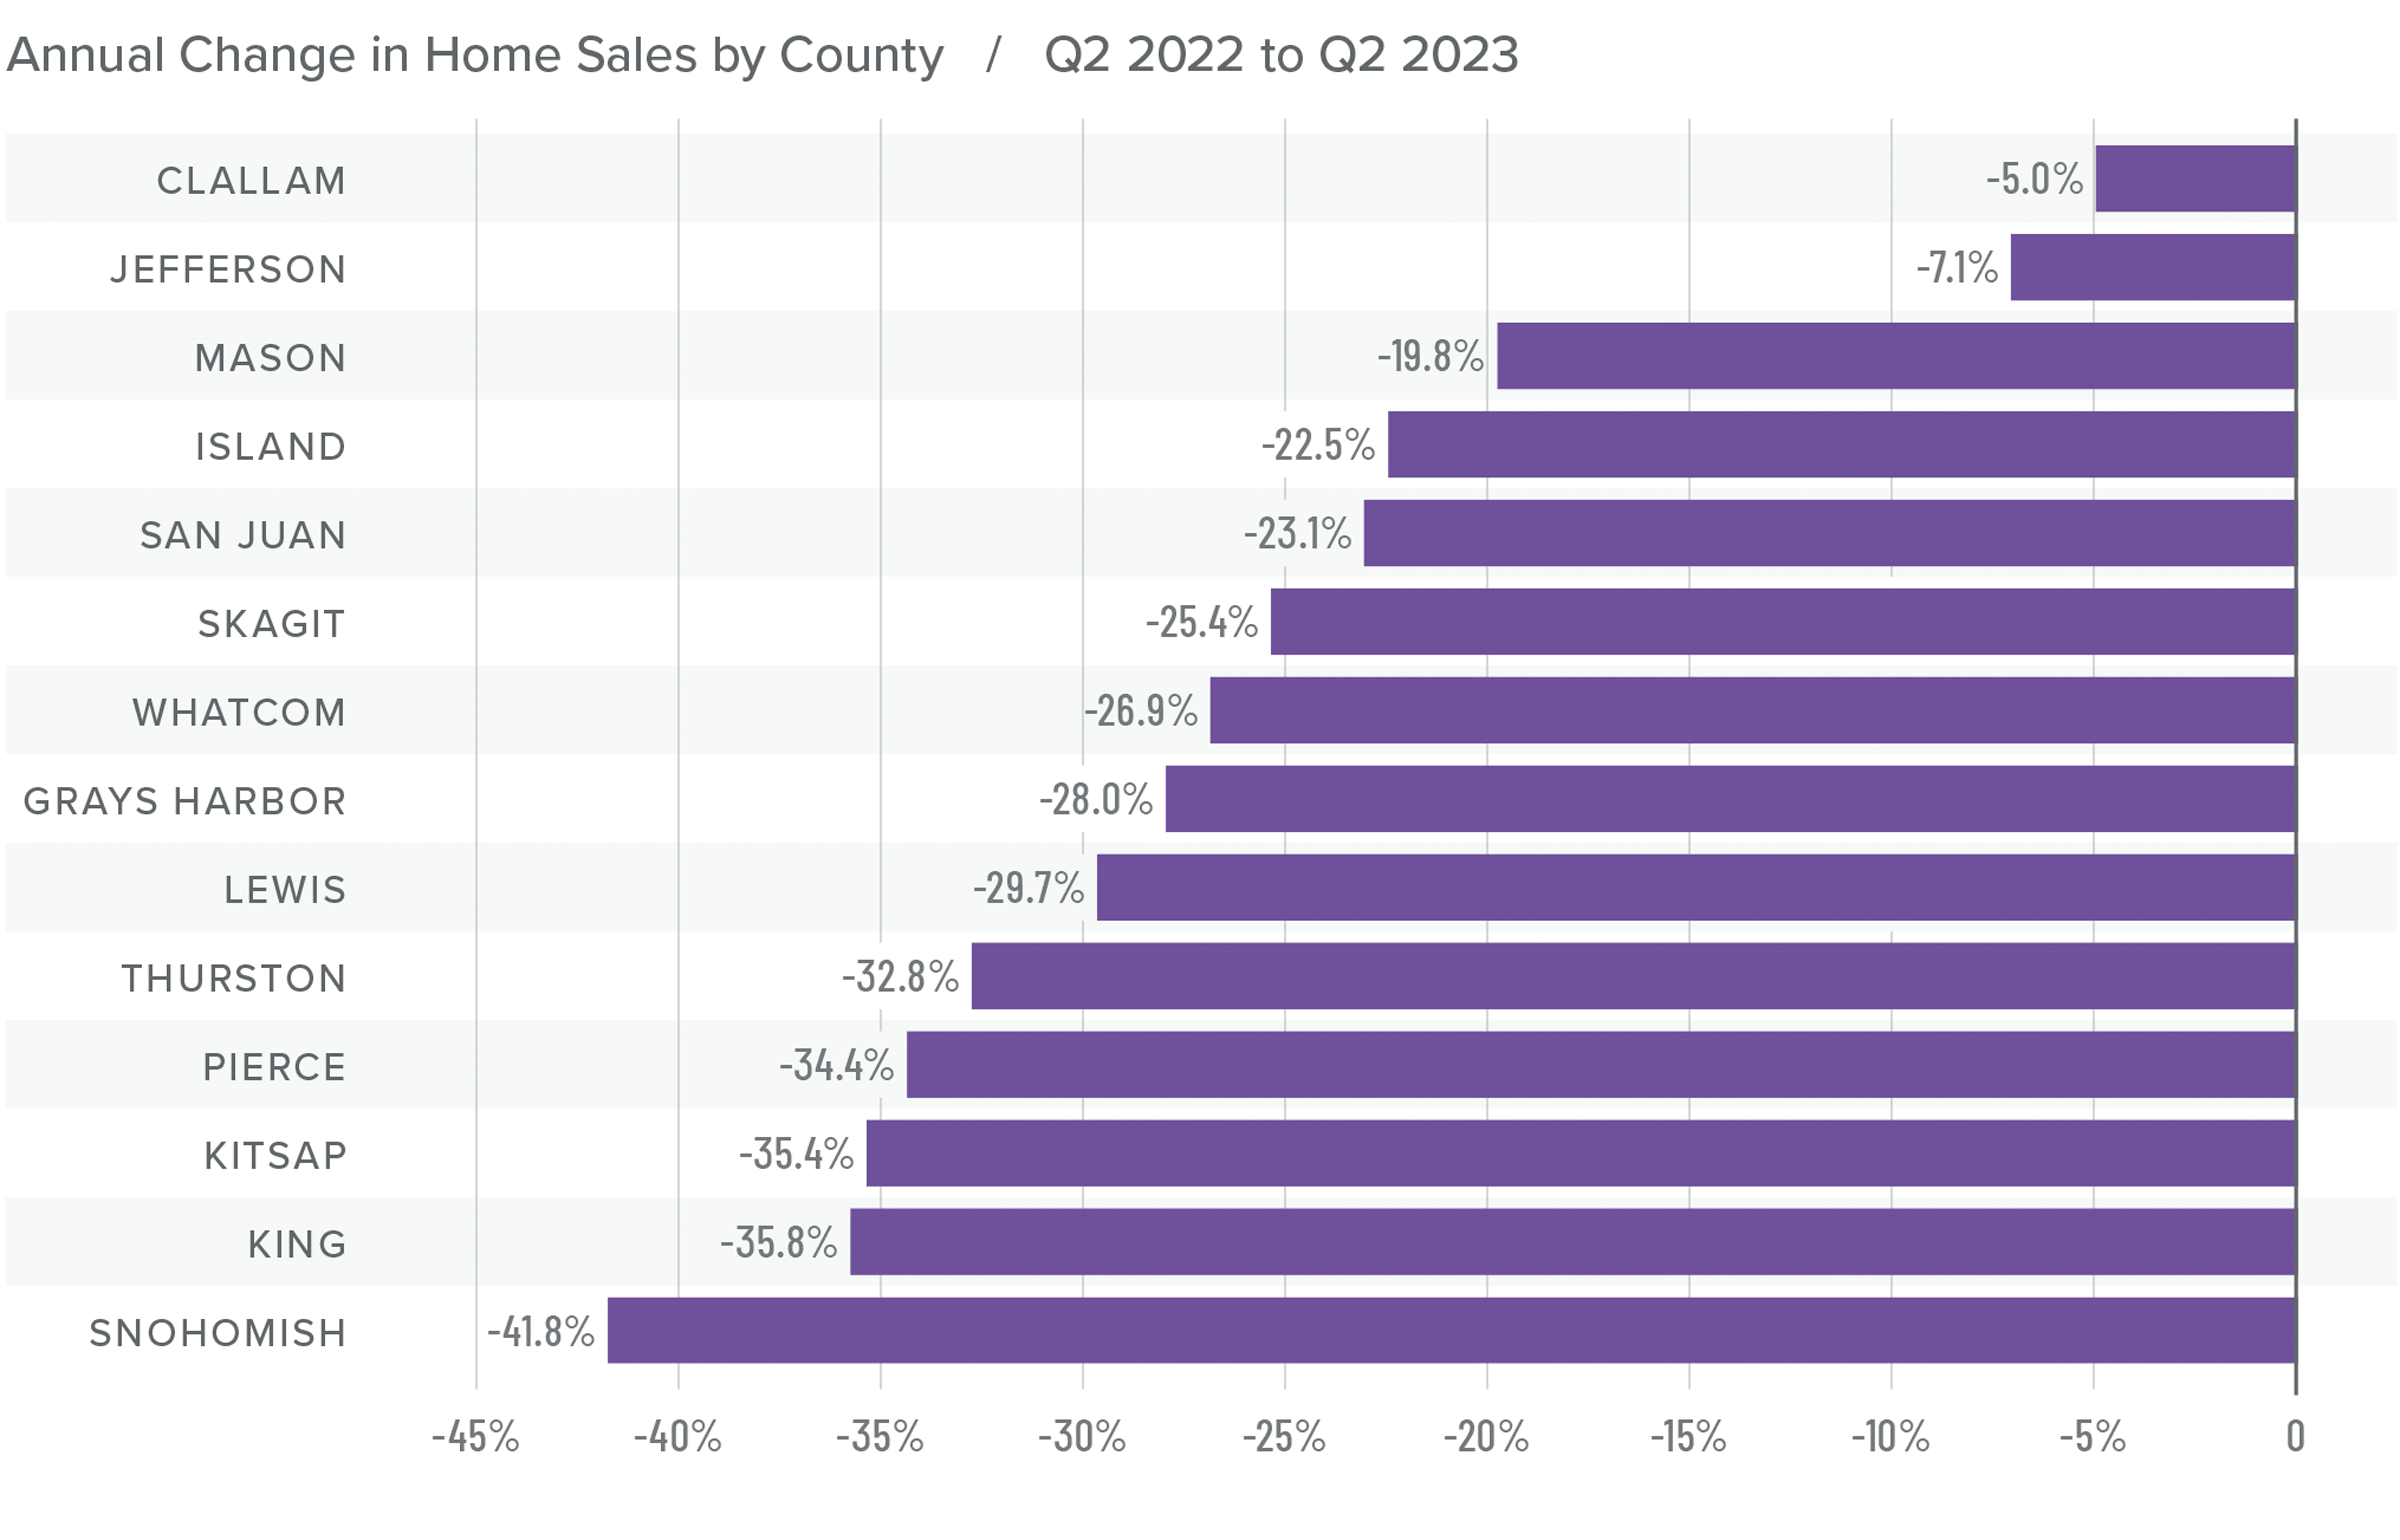
❱ In the second quarter of 2023, 14,997 homes sold. This was down 34.4% from the second quarter of 2022, but up 43.8% from the first quarter of 2023.
❱ The growth in quarter-over-quarter sales was due to the 21.7% increase in the number of homes for sale. While this is positive, it should be noted that inventory levels in the quarter were still 16% lower than a year ago.
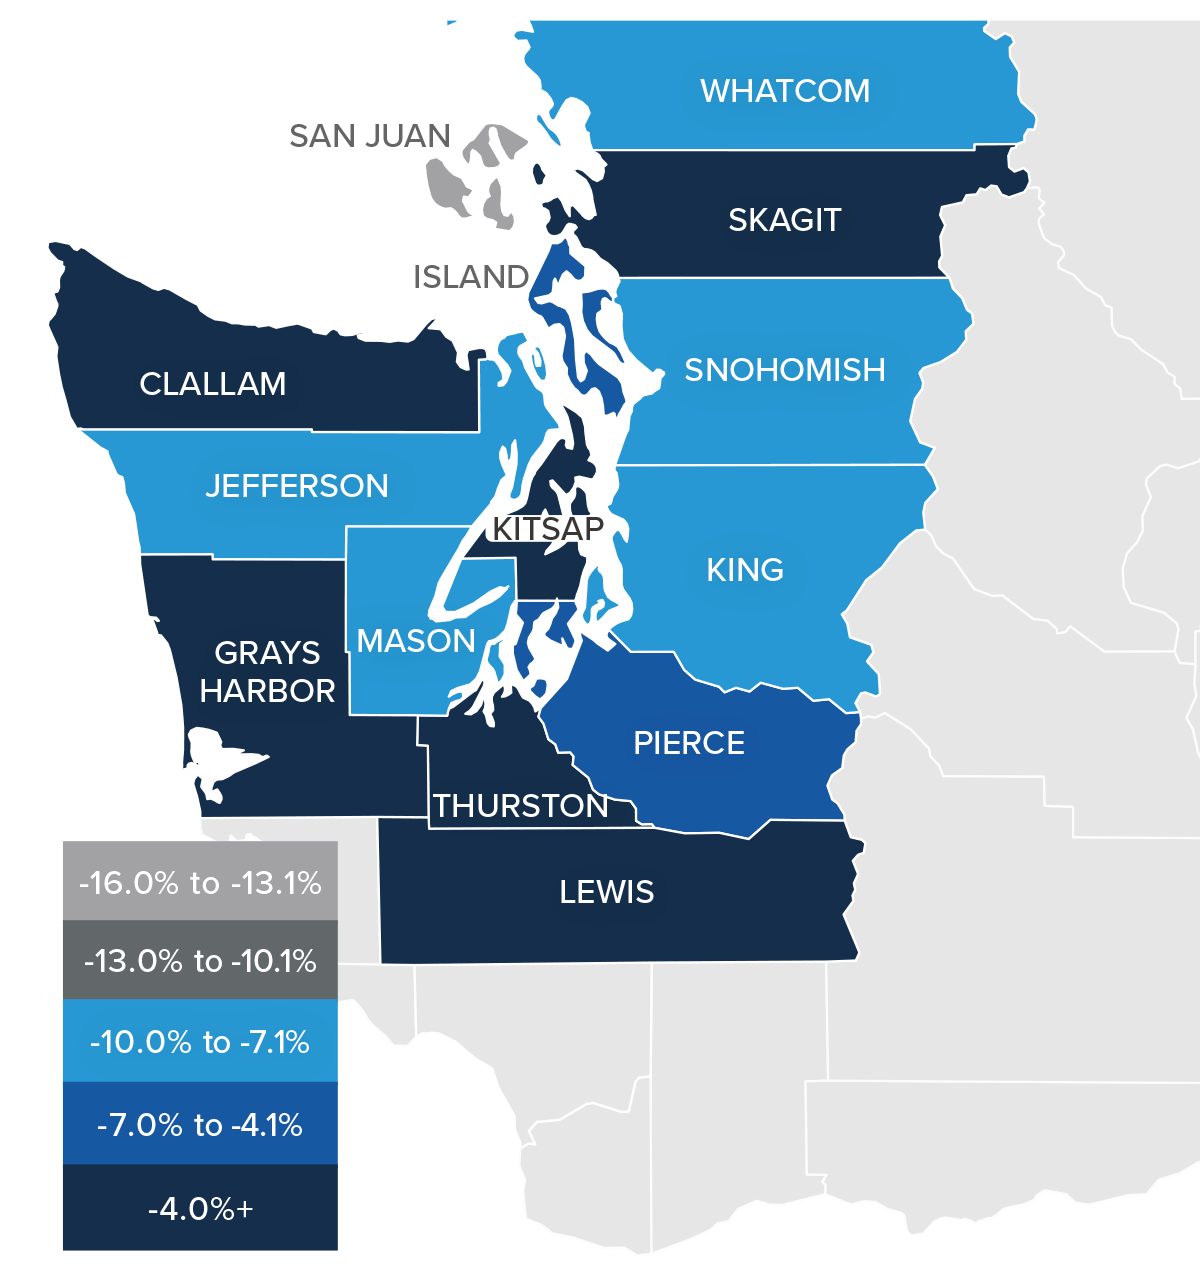
❱ Sales fell across the board compared to the same quarter in 2022 but were up in all markets compared to the first quarter of 2023.
❱ Pending sales rose in all counties compared to the first quarter of this year, suggesting that sales in the upcoming quarter may show further improvement.
Western Washington Home Prices
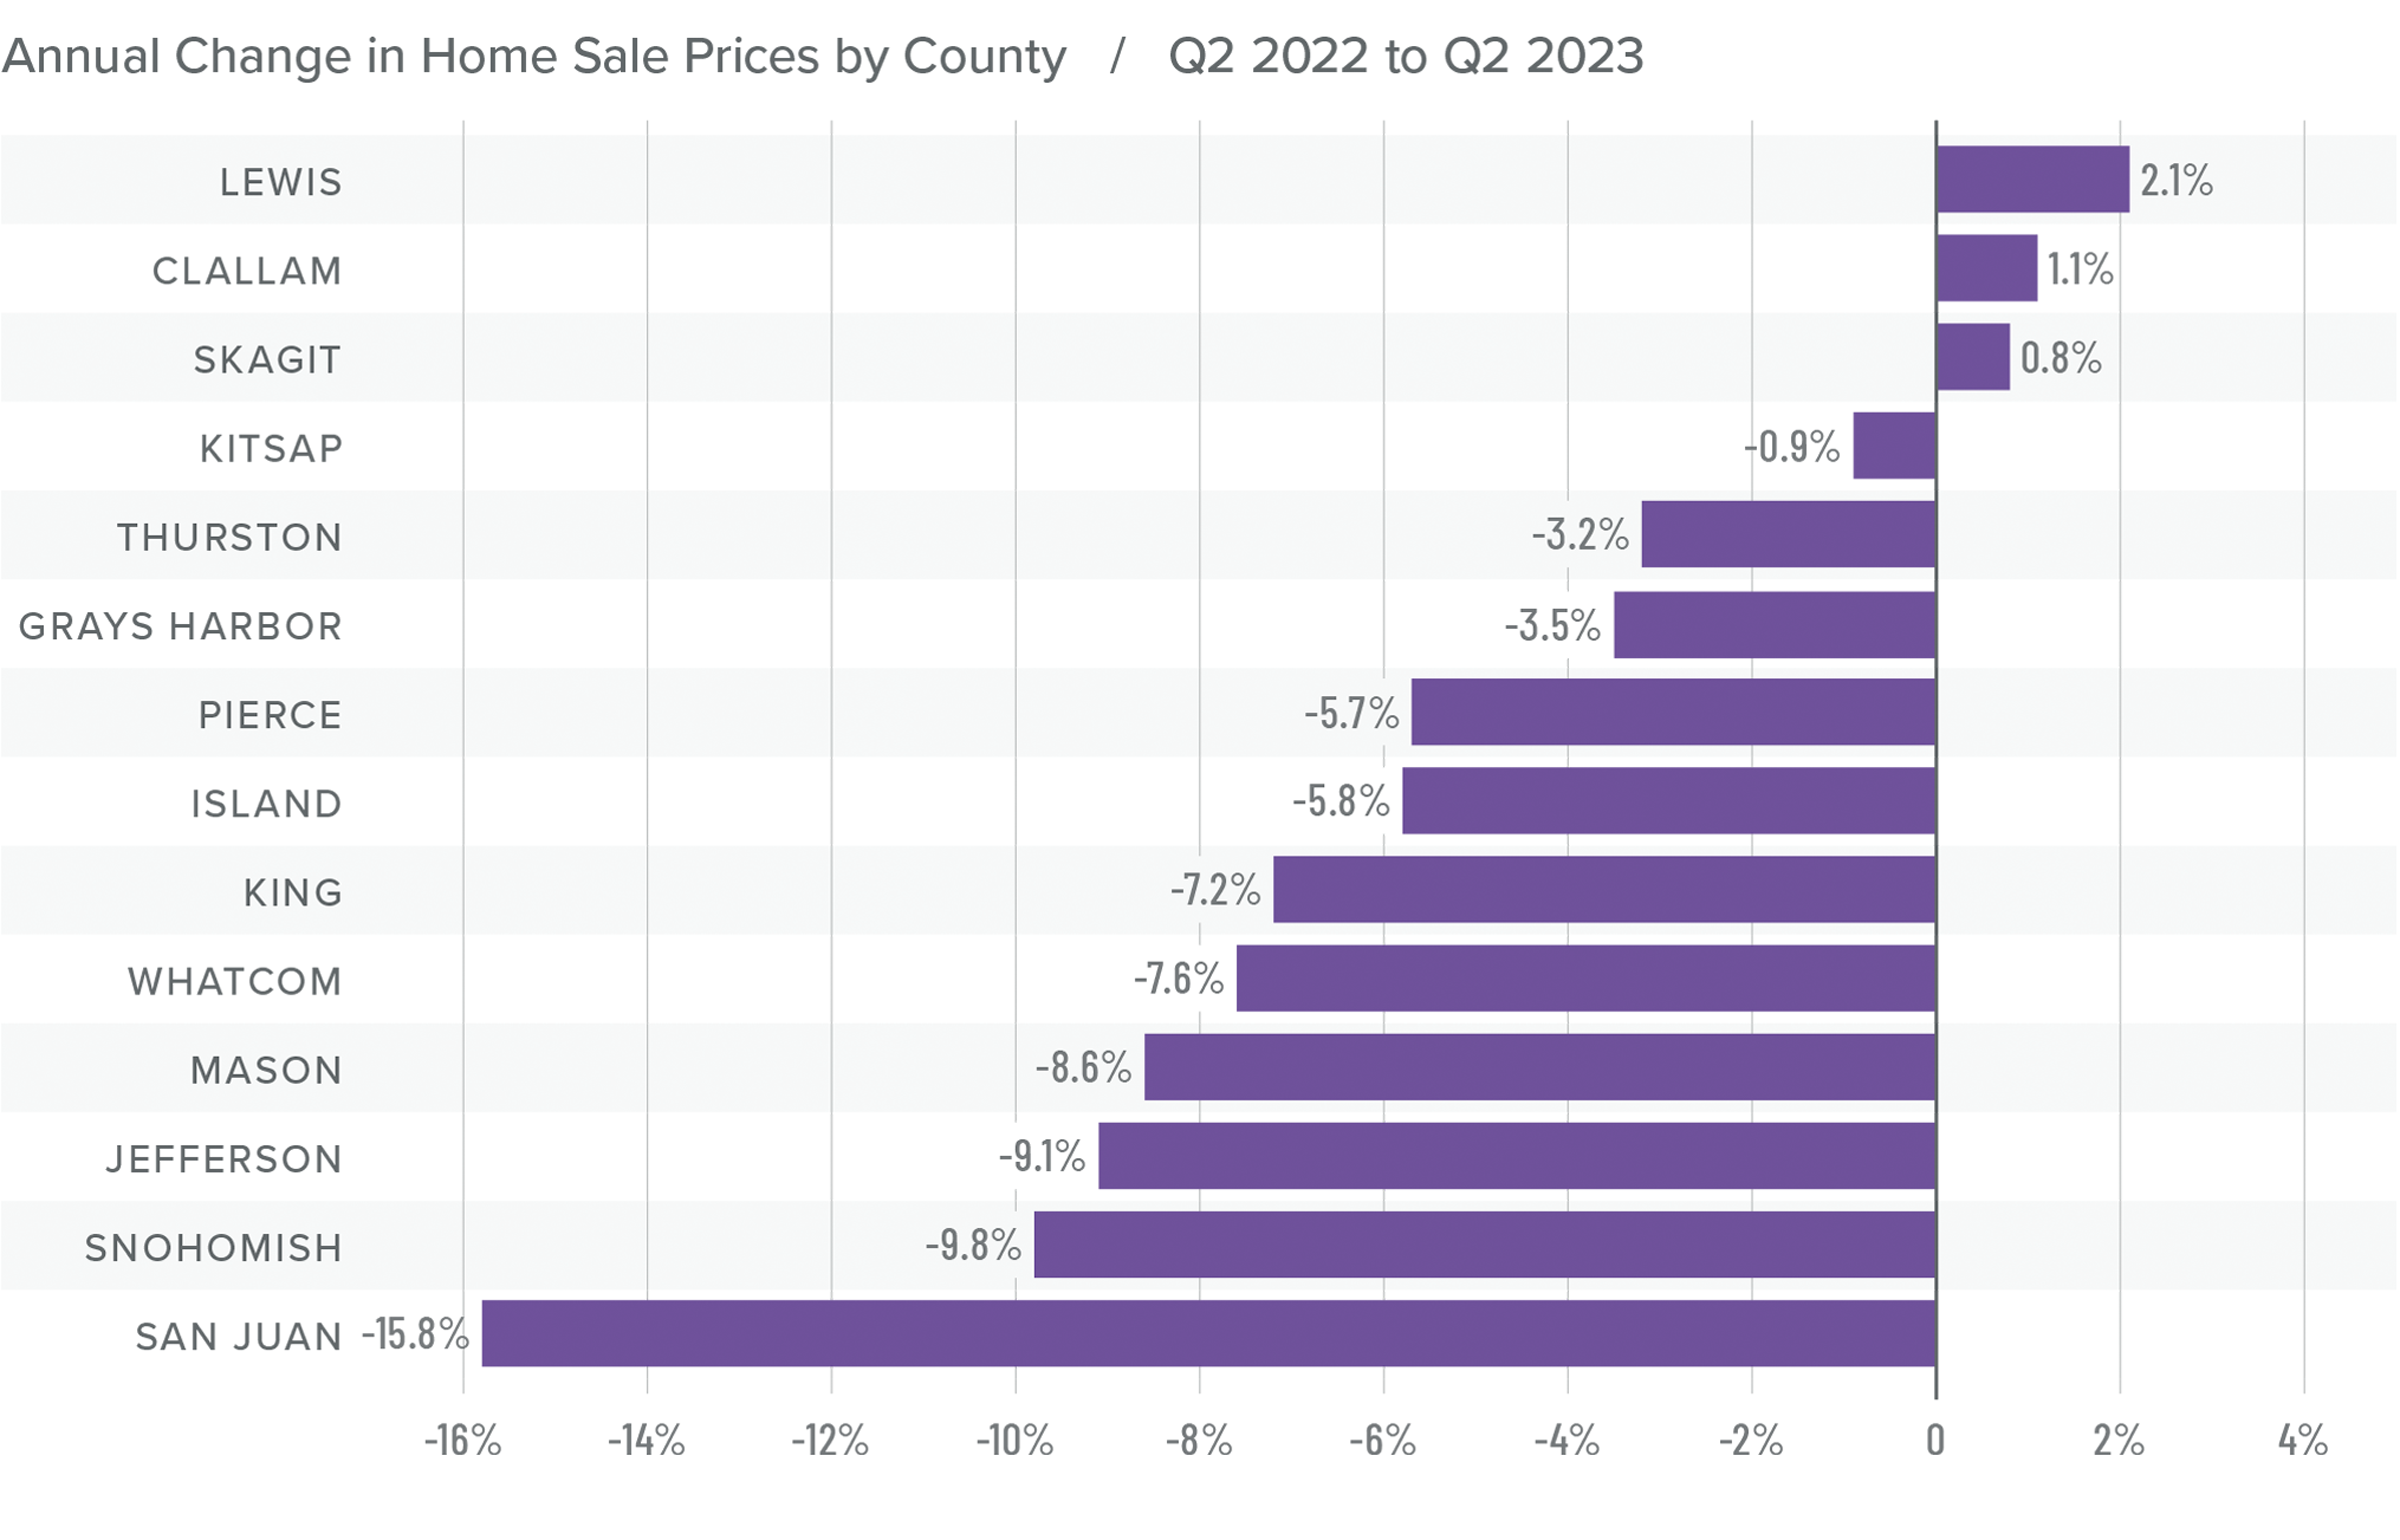
❱ Sale prices fell an average of 7.6% compared to the second quarter of 2022 but were 11.7% higher than in the first quarter of this year. The average home sale price was $773,343.
❱ Compared to the first quarter of this year, sale prices were higher in all counties except San Juan, which, as a small island county, is notorious for its extreme price swings.
❱ The year-over-year drop in sale prices was not a surprise given that the market was peaking due to rapidly rising mortgage rates. That said, prices in Lewis, Clallam, and Skagit counties exceeded those of a year ago.
❱ It was interesting to see list prices rising in all markets compared to the first quarter of the year. Even though inventory levels have risen, sellers still believe that they are in the driver’s seat.
Mortgage Rates
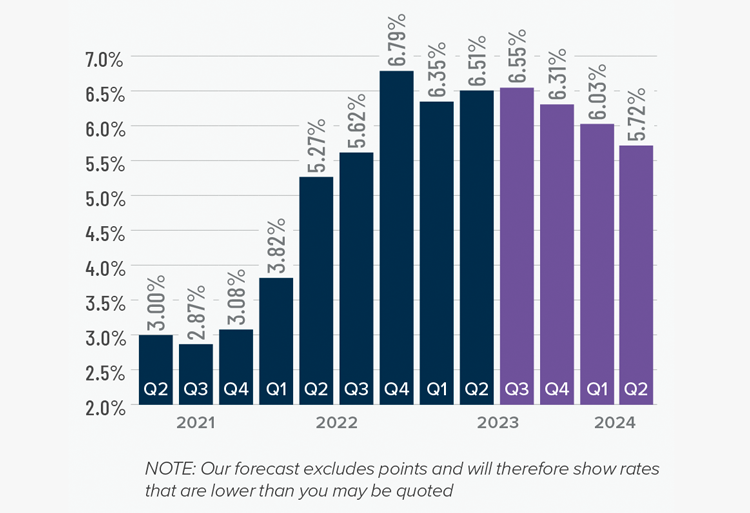
Although they were less erratic than the first quarter, mortgage rates unfortunately trended higher and ended the quarter above 7%. This was due to the short debt ceiling impasse, as well as several economic datasets that suggested the U.S. economy was not slowing at the speed required by the Federal Reserve.
While the June employment report showed fewer jobs created than earlier in the year, as well as downward revisions to prior gains, inflation has not sufficiently slowed. Until it does, rates cannot start to trend consistently lower. With the economy not slowing as fast as expected, I have adjusted my forecast: Rates will hold at current levels in third quarter and then start to trend lower through the fall. Although there are sure to be occasional spikes, my model now shows the 30-year fixed rate breaking below 6% next spring.
Western Washington Days on Market
❱ It took an average of 35 days for homes to sell in the second quarter. This was 20 more days than in the same quarter of 2022, but 21 fewer days compared to the first quarter of this year.
❱ Snohomish County became the tightest market in Western Washington, with homes taking an average of only 18 days to sell. Homes for sale in San Juan County took the longest time to sell at 81 days.
❱ All counties contained in this report saw average days on market rise from the same period in 2022. Market time fell across the board compared to the prior quarter.
❱ The greatest fall in days on market compared to the first quarter was in Clallam County, where market time fell 31 days. Also of note were Pierce, Thurston, and Whatcom counties, where market time fell 25 days.

Conclusions
This speedometer reflects the state of the region’s real estate market using housing inventory, price gains, home sales, interest rates, and larger economic factors.
The increase in listing activity, while pleasing, still leaves the market short of inventory. Even with mortgage rates well above levels we’ve seen over the past few years, demand for homes still exceeds supply. Given that over 86% of homeowners with mortgages have an interest rate below 5% and more than a quarter have a rate at or below 3%, I see little incentive for them to sell if they don’t have to. This tells me that supply levels are unlikely to improve enough to meet demand until rates drop significantly.
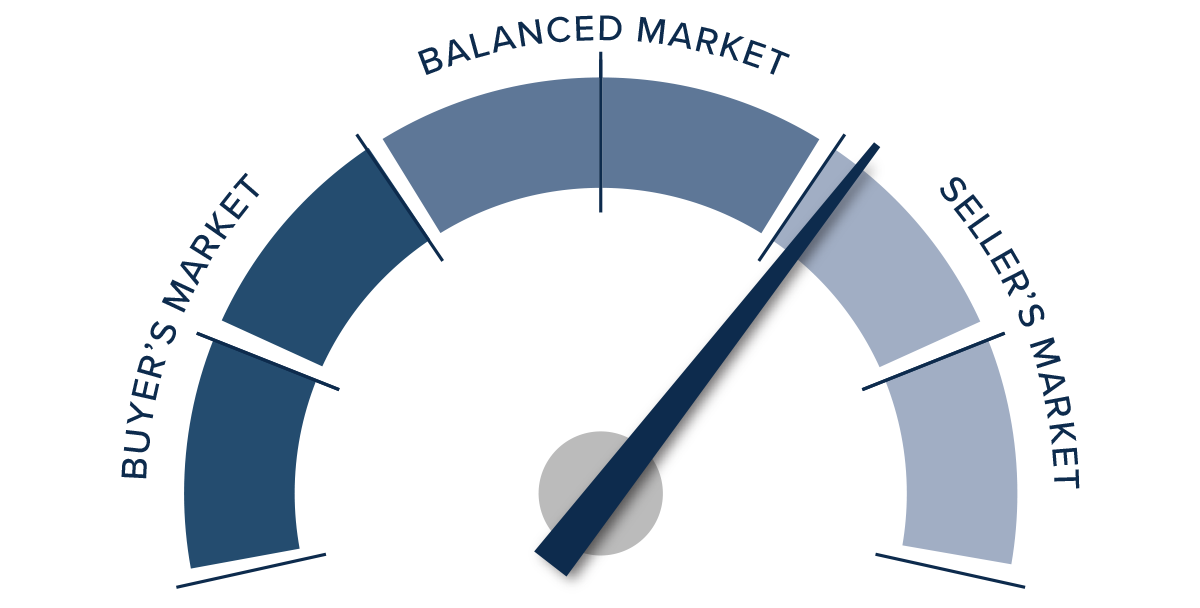
With this supply-demand imbalance, it’s no surprise that prices are rising again following the decline in the second half of 2022. I expect prices to rise modestly as we move through the second half of 2023. Rising list and sale prices, shorter time on market, and higher pending and closed sales all offset higher mortgage rates. Given these factors, I have moved the needle in favor of sellers.
About Matthew Gardner

As Chief Economist for Windermere Real Estate, Matthew Gardner is responsible for analyzing and interpreting economic data and its impact on the real estate market on both a local and national level. Matthew has over 30 years of professional experience both in the U.S. and U.K.
In addition to his day-to-day responsibilities, Matthew sits on the Washington State Governors Council of Economic Advisors; chairs the Board of Trustees at the Washington Center for Real Estate Research at the University of Washington; and is an Advisory Board Member at the Runstad Center for Real Estate Studies at the University of Washington where he also lectures in real estate economics.


