 Facebook
 X
X
 Pinterest
 Copy Link


Windermere Chief Economist Matthew Gardner gives an updated look at U.S. home prices and housing affordability in 2023 by examining two key second-quarter reports from ATTOM Data Solutions and the National Association of Home Builders (NAHB).
This video is the latest in our Monday with Matthew series with Windermere Chief Economist Matthew Gardner. Each month, he analyzes the most up-to-date U.S. housing data to keep you well-informed about what’s going on in the real estate market.
U.S. Home Prices 2023
Hello there, I’m Windermere Real Estate’s Chief Economist Matthew Gardner and welcome to this month’s episode of Monday with Matthew. Today we are going to look at home prices and housing affordability. To do this I will be looking at the second quarter sales price data from ATTOM Data Solutions and we will also look at the just released National Association of Home Builders Housing Opportunity Index for the second quarter.
Are home prices dropping?
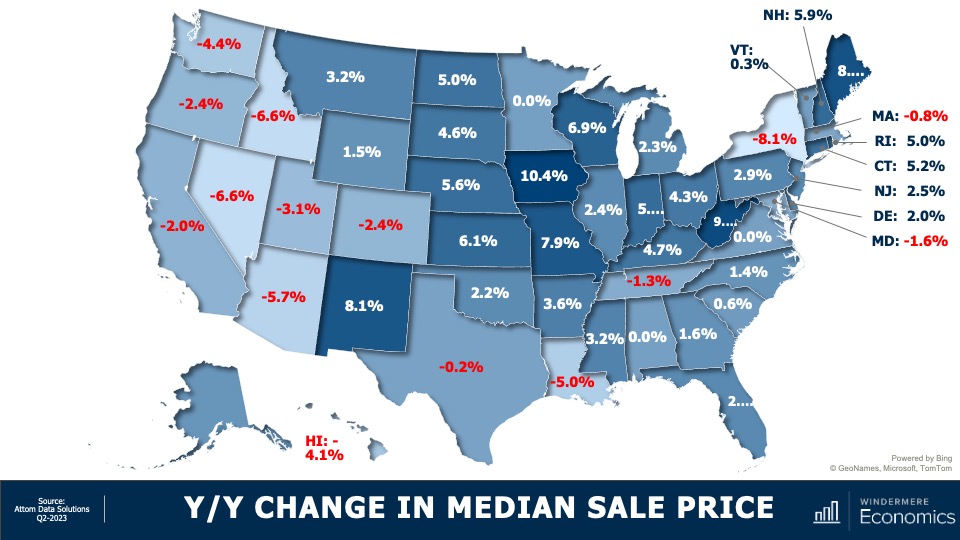
Starting with the year-over-year change in sale prices at the state level, there aren’t any great surprises. For the past several months I’ve been saying that as the Western U.S. saw the greatest price growth during the pandemic, so it’s not surprising to see most states sale prices in the quarter below the level seen a year ago. But it was pleasing to see that sale prices in 36 states either matched the level seen a year ago or were higher, and in some instances quite significantly so.
U.S. Home Sale Prices 2023 By State
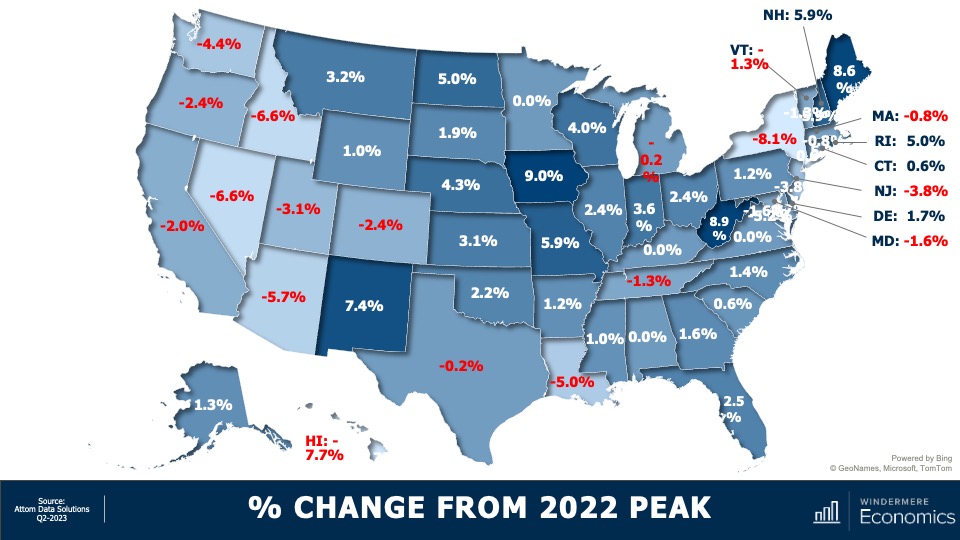
And when we compare second quarter sale prices to their 2022 peaks, 33 states are at or above the highs seen last year, but most of the Western States have yet to fully recover. In the South, Louisiana is still lagging by a good amount, as is New York State on the East Coast.
But as you are all very aware, all markets are different. I thought it would be interesting to dig a little deeper into the data to see which metro markets have seen significant gains over the past 12 months. It’s going to be interesting specifically because of the fact that mortgage rates have risen so much.
Metro Areas: Home Sale Prices 2023
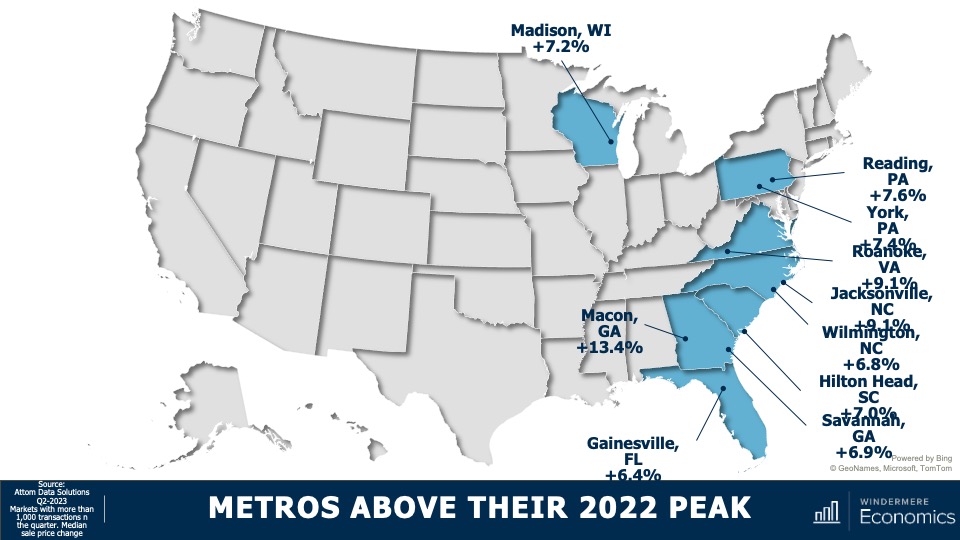
These are markets where sale prices are far above their 2022 peak sale prices. Now I must add that I only looked at markets where more than 1,000 transactions occurred in the last quarter, which takes out some of the volatility. Notably, even though the state of Virginia’s home prices in the quarter were flat when compared to their 2022 peak, the Roanoke market was up by over 9%. And in Pennsylvania, where state prices were only 1.2% above their 2022 peak, Reading is up by 7.6% and York by 7.4%. And in Georgia, where state sale prices were up a modest 1.6%, homes in Macon have leapt by over 13% and prices are up by 6.9% in Savannah.
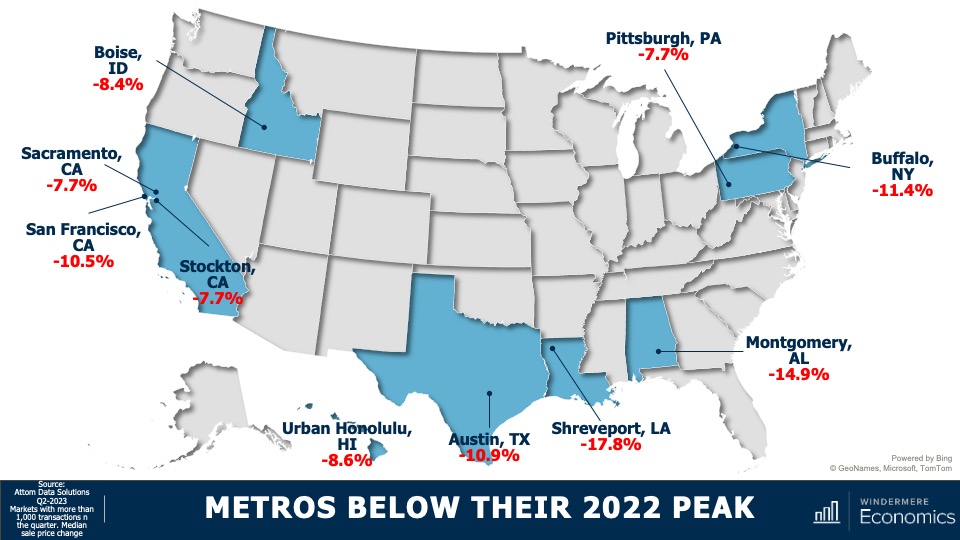
But, on the other end of the spectrum, there are markets which are underperforming their respective states and, unsurprisingly, California tops the list with three of their metros seeing prices significantly below that of the state as a whole. In other parts of the country, several metro areas which were relatively affordable before the pandemic saw an influx of remote workers and this led prices to skyrocket, and these will take some time to recover. This is particularly true in the Austin and Boise market areas.
I would add that, of the counties across the country where there were more than 1,000 transactions in the second quarter, half have met or exceeded their prior peak and—of the half where sale prices were still lower—the average shortfall is only around 4% and there are just seven counties in the country where sale prices are down by more than 10% from their 2022 peaks.
Now, what I see in the data is that the U.S. housing market, although certainly not fully healed, is headed in the right direction even when faced with mortgage rates that remain remarkably high. So, with sale prices recovering and still faced with stubbornly high financing costs, what does affordability look like?
U.S. Housing Affordability 2023
Well, according to the National Association of Homebuilders (NAHB), of the 241 metros that they track, just 40.5% of sales in the second quarter were affordable to households making the area’s median income—that’s the second lowest share of sales seen since they started generating this dataset a decade ago. Now, their data does go back to 2004, but the interest rate series that they used to use was discontinued, so it’s not accurate to compare their data today with anything before 2012.
Most Affordable U.S. Housing Markets
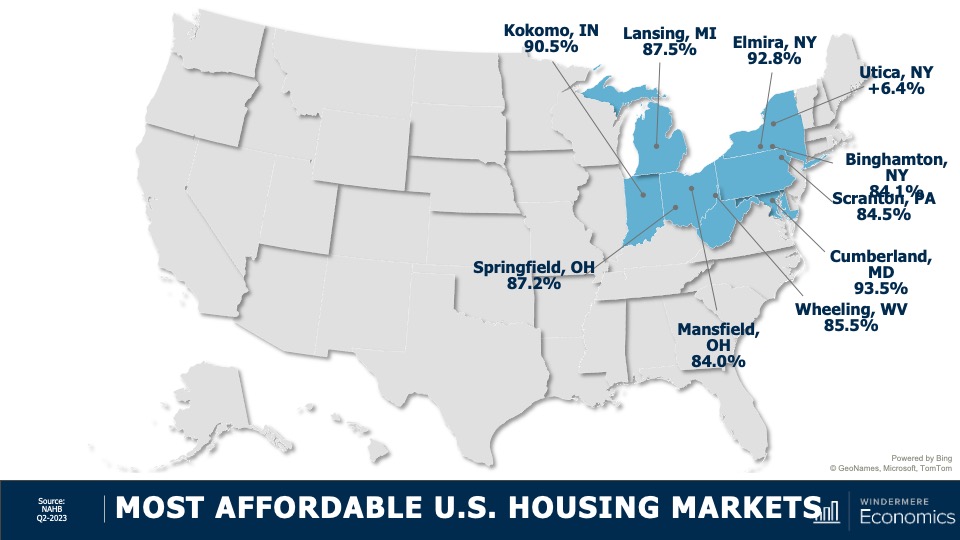
These were the most affordable markets in the second quarter and their locations should not be of any great surprise. Average sale prices in these markets were measured around $203,000—that’s just marginally above 50% of the national sale price in the quarter, which was $402,600.
Least Affordable U.S. Housing Markets
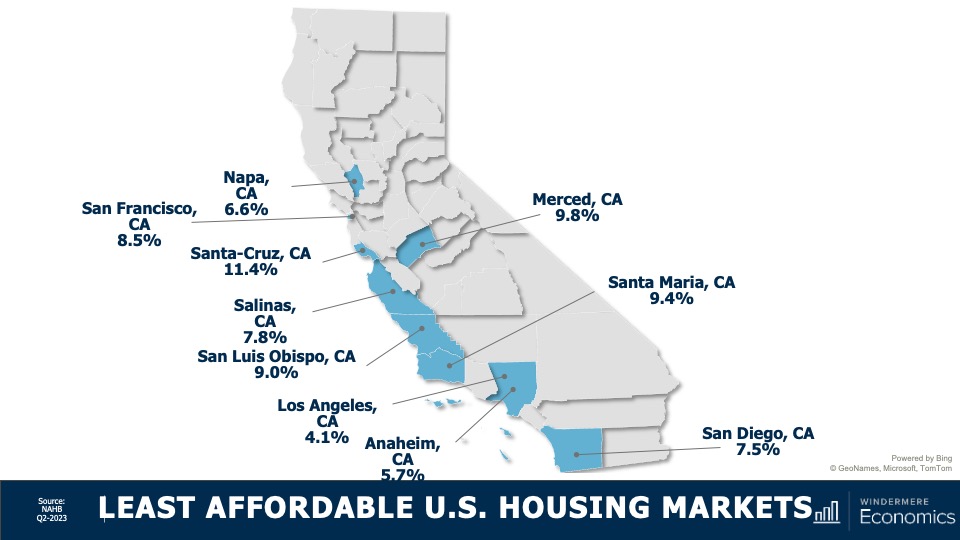
And unfortunately this should not surprise you either. On the other end of the spectrum, the top-10 least affordable housing markets were all in California, but it gets worse than that. The top 15 least affordable markets again, all in California, and 19 out of the top 25 were in the Golden State!
As far as I can see, the ownership housing market is still showing remarkable resiliency, especially given that mortgage rates have more than doubled from their lows and they’ve risen from 4.8% at the start of the second quarter of last year to 7% at the end of the second quarter of 2023.
Now, I still expect to see rates starting to slowly move lower as we go through the second half of the year. This will help with prices and, to a degree, affordability, but until we see a significant increase in the number of homes listed for sale, the market is going to remain unbalanced.
As always, I’d love to hear your thoughts on this subject so feel free to leave your comments below. Until next month, stay safe out there and I’ll see you soon. Bye now.
To see the latest real estate market data for your area, visit our quarterly Market Updates page.
About Matthew Gardner
As Chief Economist for Windermere Real Estate, Matthew Gardner is responsible for analyzing and interpreting economic data and its impact on the real estate market on both a local and national level. Matthew has over 30 years of professional experience both in the U.S. and U.K.
In addition to his day-to-day responsibilities, Matthew sits on the Washington State Governors Council of Economic Advisors; chairs the Board of Trustees at the Washington Center for Real Estate Research at the University of Washington; and is an Advisory Board Member at the Runstad Center for Real Estate Studies at the University of Washington where he also lectures in real estate economics.


